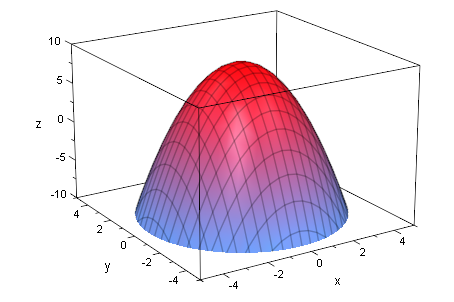
plotfunc3d(9-x^2-y^2,x=-5..5,y=-5..5,ViewingBoxZRange=-10..10)
Analysis 3D, Der Hut und Verwandtes
Mathematik mit MuPAD 4, Prof. Dr. Dörte Haftendorn 02 Update Juni 07
https://mathe.web.leuphana.de www.mathematik-verstehen.de
####################################################################
Hut in der Vorlesung, 3D- Lernen
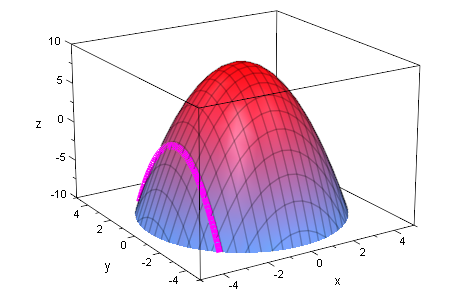
plotfunc3d(9-x^2-y^2,x=-5..5,y=-5..5,ViewingBoxZRange=-10..10)
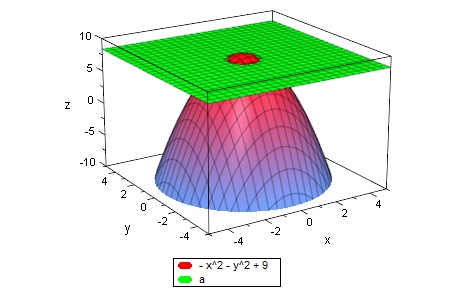
Mit Ebene in Höhe a
plotfunc3d(9-(x^2+y^2),a,x=-5..5,y=-5..5,a=-10..10,ViewingBoxZRange=-10..10)

Edlere Ausführung mit beweglichen Kurven
hut:=(x,y)->9-(x^2+y^2); hut(x,y)
![]()
![]()
hutg:=plot::Function3d(hut(x,y),x=-5..5,y=-5..5,ViewingBoxZRange=-10..10):
plot(hutg)

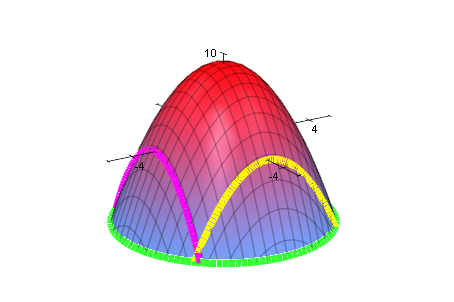
schnittezy:=plot::Curve3d([x,y,hut(x,y)],x=-5..5,y=-3..3,
LineWidth=2,LineColor=[1,1,0], Axes=Origin):
plot(schnittezy,hutg)
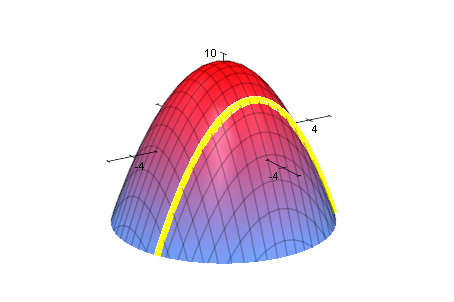
schnittezx:=plot::Curve3d([x,y,hut(x,y)],y=-5..5,x=-3..3,
LineWidth=2,LineColor=[1,0,1])
![]()
plot(hutg, schnittezx)
r:=a->sqrt(9-a):rr:=5:
schnittexy:=plot::Curve3d([r(a)*cos(t),r(a)*sin(t),a],t=0..2*PI,a=-10..9,
LineWidth=2,LineColor=[0.2,1,0.2])
![]()
plot(schnittexy,hutg,schnittezx, schnittezy)
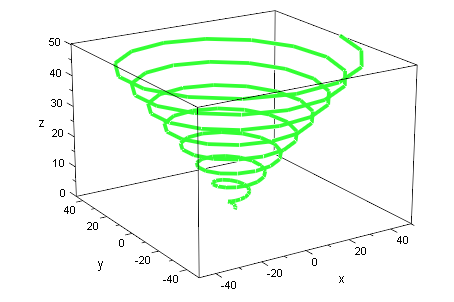
schraubetoll:=plot::Curve3d([r(a)*cos(t),r(a)*sin(t),a*t],t=0..6*PI,a=-10..9,
LineWidth=2,LineColor=[0.2,1,0.2])
![]()
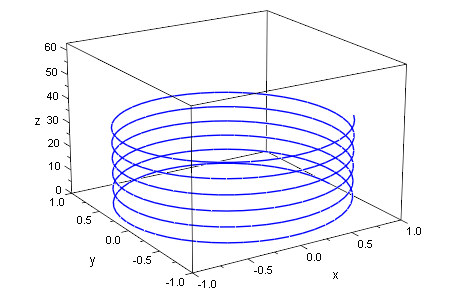
rr:=4: schraube:=plot::Curve3d([t*cos(t),t*sin(t),t],t=0..a,a=16*PI..0,
LineWidth=1,LineColor=[0.2,1,0.2],
AnimationStyle=BackAndForth)
![]()
plot(schraube)
billig:=plot::Curve3d([cos(t),sin(t),t],t=0..a, a=0..20*PI,Mesh=300):plot(billig)
indien:=plot::Curve3d([1/t*cos(t),1/t*sin(t),t],t=0..a, a=0..20*PI,Mesh=300):plot(indien)
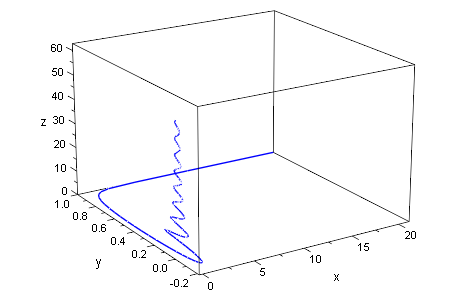
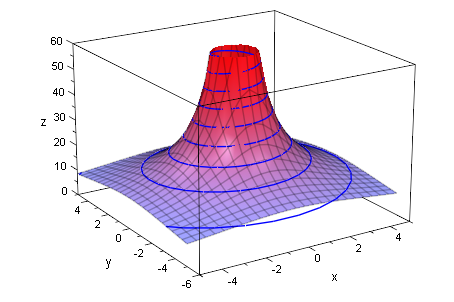
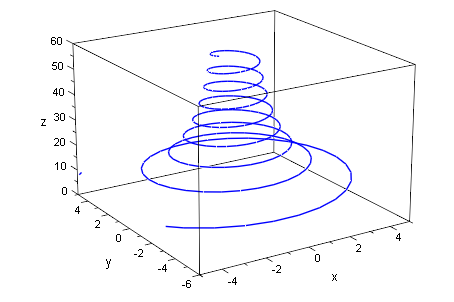
Tanne:=plot::Curve3d([60/t*cos(t),60/t*sin(t),t],t=0.3..a, a=0..20*PI,Mesh=300,
ViewingBox=[-5..5,-6..5,0..60]
):plot(Tanne)
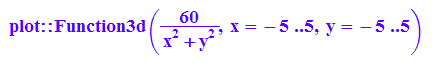
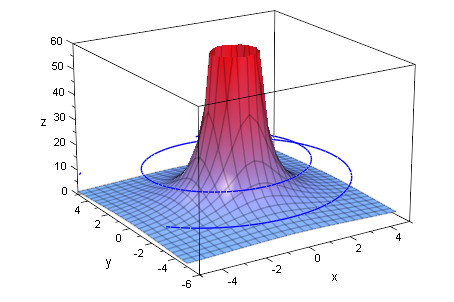
Schornstein:=plot::Function3d((60/(x^2+y^2)),x=-5..5,y=-5..5,ViewingBoxZRange=0..60)
plot(Schornstein,Tanne)
Schornstein2:=plot::Function3d((60/sqrt(x^2+y^2)),x=-5..5,y=-5..5,ViewingBoxZRange=0..60):
plot(Schornstein2,Tanne)