Iteration-Rekursion
Prof. Dr. Dörte Haftendorn, MuPAD 4, https://mathe.web.leuphana.de Aug.06 März 09
Okt. 05 Update31.3.09
Web: https://mathe.web.leuphana.de www.mathematik-verstehen.de
+++++++++++++++++++++++++++++++++++++++++++++++++++++++++++++++++++++
####################################################
Achtung, Doppelklick im Graph und Player oben bedienen!
Die Erzeugung dieses Bildes steht weiter unten.
Logistische Parabel
start:=0.05: rmin:=0:rmax:=4:
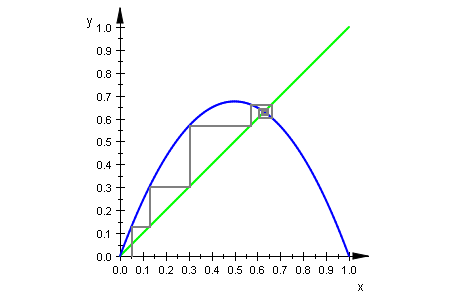
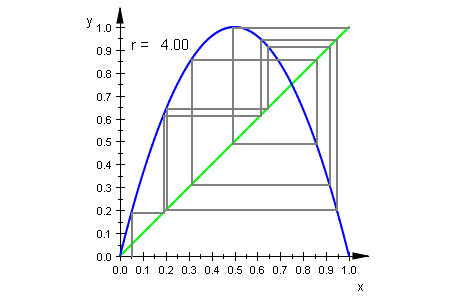
Web-Graph
wh:= plot::Function2d(x, x = 0..1,LineWidth=0.6, Color=RGB::Green):
f:=x->r*x*(1-x);
r:=2.7:
gf:= plot::Function2d(f(x), x = 0..1, LineWidth=0.6, XAxisTitle=""):
it := plot::Iteration(f(x), start, x = 0..1,
LineStyle=Solid, LineWidth=0.6):
webg:=wh,gf,it:
sceneWeb:=plot::Scene2d(wh,gf,it):
plot(sceneWeb)
![]()
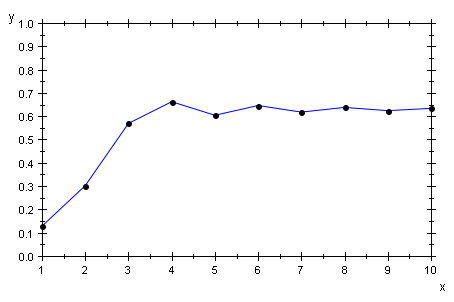
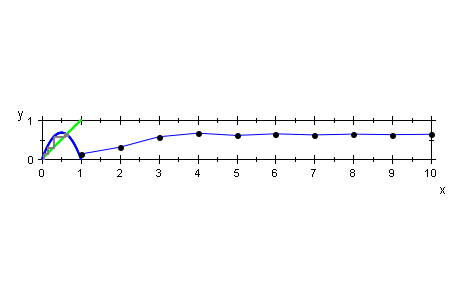
Zeitdarstellung (Einfachversion)
folge:=(f@@i)(start) $ i=1..10:
folgeg:=plot::Listplot([folge]):
sceneTime:=plot::Scene2d(folgeg, ViewingBox=[1..10,0..1]):
plot(sceneTime);
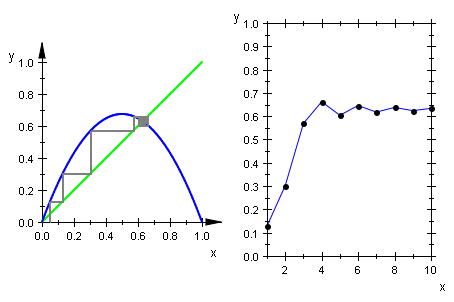
plot(sceneWeb,sceneTime);
plot(webg,folgeg)
Nun soll r als Parameter verwendet werden
delete r:r;
![]()
rmin:=0: rmax:=4:
rwerte2d:=proc(rmin,rmax,linksx,linksy,anzpe)
begin
return(
plot::Text2d(r->"r = ".stringlib::formatf(r, 2),
[linksx,linksy], r=rmin..rmax,
HorizontalAlignment=Left),
Frames=round((rmax-rmin)*anzpe+1 ))
end_proc;
![]()
wert:=rwerte2d(rmin,rmax,0.05,0.9,10):
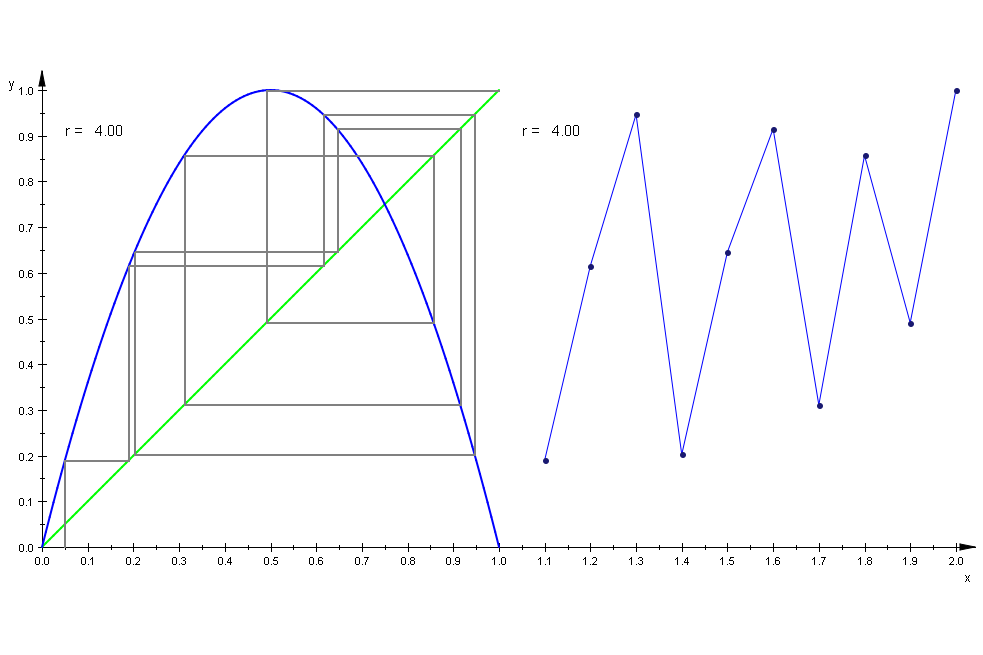
Bei den animierten Graphen kann man den Zusammenhang sehen:
gf:= plot::Function2d(f(x), x = 0..1,r=rmin..rmax, LineWidth=0.6):
it := plot::Iteration(f(x), start, x = 0..1,r=rmin..rmax,
LineStyle=Solid, LineWidth=0.6):
sceneWeb:=plot::Scene2d(wh,gf,it,wert,ViewingBox=[0..1,0..1]):
plot(sceneWeb)
Achtung, Doppelklick im Graph und Player oben bedienen!
Nun sollen die beiden Arten gemeinsam dargestellt werden.
folge:=[1+i/10,(f@@i)(start)] $ i=1..10:
folgeg:=plot::Polygon2d([folge],r=rmin..rmax):
pkte:=plot::PointList2d([folge],r=rmin..rmax):
wertTime:=rwerte2d(rmin,rmax,1.05,0.9,10):
plot(wh,gf,it,wert,folgeg,pkte,wertTime, ViewingBox=[0..2,0..1]):
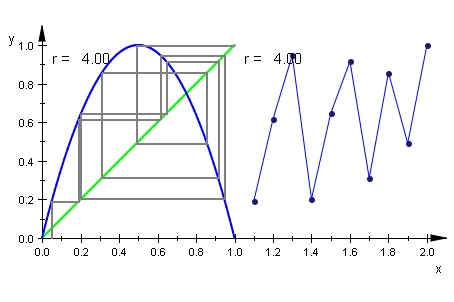
Achtung, Doppelklick im Graph und Player oben bedienen!
Die oben stehende Art ist besser.
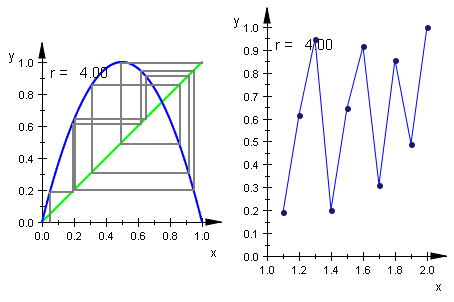
plot(sceneWeb,sceneTime);
##################################################
Unabhängigkeit vom Startwert:
r:=2.7:
gf:= plot::Function2d(f(x), x = 0..1, LineWidth=0.6):
it := plot::Iteration(f(x), st, x = 0..1, st=0..1,
LineStyle=Solid, LineWidth=0.6):
plot(wh,gf, it)

Achtung, Doppelklick im Graph und Player oben bedienen!
##################################################
#######################################
Beliebige Funktionen
####################################################
beliebige Fkt-Schar (r), die wh schneidet
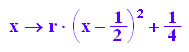
f:=x->r*(x-1/2)^2+1/4;
xmin:=-1.5:xmax:=2.5: start:=0.05:
wh:= plot::Function2d(x, x = xmin..xmax,LineWidth=0.6, Color=RGB::Green):
r:=1:
gf:= plot::Function2d(f(x), x = xmin..xmax, LineWidth=0.6):
it := plot::Iteration(f(x), start, x = xmin..xmax,
LineStyle=Solid, LineWidth=0.6):
plot(wh,gf, it,ViewingBoxYRange=0..xmax)
delete r:r;
![]()
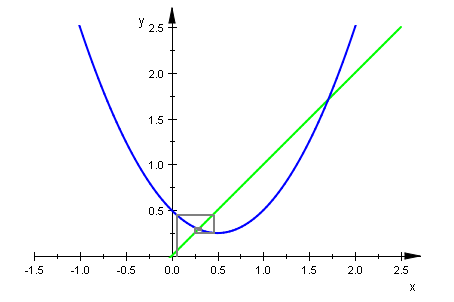
Bei den animierten Graphen kann man den Zusammenhang sehen:
rmin:=0: rmax:=1:xmin:=-1: xmax:=3:start:=-1:
wert:=rwerte2d(rmin,rmax,start,0.9,10):
gf:= plot::Function2d(f(x), x = xmin..xmax,r=0..1, LineWidth=0.6):
it := plot::Iteration(f(x), start, x = xmin..xmax,r=rmin..rmax,
LineStyle=Solid, LineWidth=0.6):
plot(wh,gf, it,wert,ViewingBoxYRange=0..3)
Achtung, Doppelklick im Graph und Player oben bedienen!
##################################################
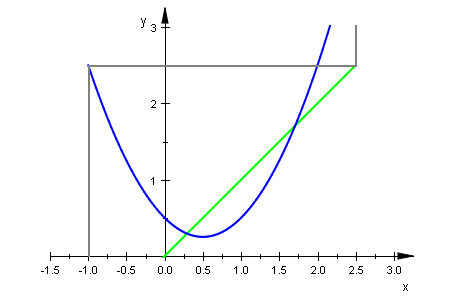
Unabhängigkeit vom Startwert:
r:=1:
gf:= plot::Function2d(f(x), x = xmin..xmax, LineWidth=0.6):
it := plot::Iteration(f(x), st, x = xmin..xmax, st= xmin..xmax,
LineStyle=Solid, LineWidth=0.6):
plot(wh,gf, it)
Achtung, Doppelklick im Graph und Player oben bedienen!
##################################################