Der Höhenschnittpunkt wandert.
Prof. Dr. Dörte Haftendorn, MuPAD 4, http://haftendorn.uni-lueneburg.de Okt.06
Koordinatensystem-Ursprung in der Mitte von AB. GeoGebra-Datei existiert.
b:=x->m*(x+r);
hb:=x->-1/m*(x-r);
g:=a;
![]()
![]()
![]()
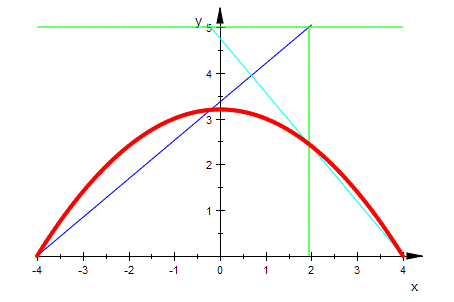
Seite b und Höhe hb als Gerade, Straße g im Abstand a
Für die Steigung von b gilt
m:=a/(r+x);
![]()
Eingesetzt in hb ergibt:
p:=x->-(r+x)/a*(x-r);p(x)
![]()
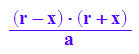
expand(p(x))

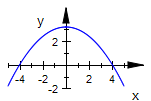
Wie aus GeoGebra erwartet, handelt es sich um eine nach unten geöffnete
Parabel durch A und B.
r:=4: a:=5:
plotfunc2d(p(x))
Einzeichnen der gesamten Situation:
r:=4: a:=5:delete m:
gb:=plot::Function2d(b(x),x=-1.5*r..1.5*r,m=-.2..10):
ghb:=plot::Function2d(hb(x),x=-1.5*r..1.5*r,m=-.2..10,LineColor=[0,1,1]):
gg:=plot::Function2d(a,x=-1.5*r..1.5*r,LineColor=RGB::Green):
ghc:=plot::Curve2d([a/m-r,v],v=0..a,m=-.2..10, LineColor=RGB::Green):
gp:=plot::Function2d(p(x),x=-1.5*r..1.5*r,
LineColor=[1,0,0], LineWidth=1):
plot(gb,ghb,gg,ghc,gp, Scaling=Constrained, ViewingBox=[-4..r,0..a]):