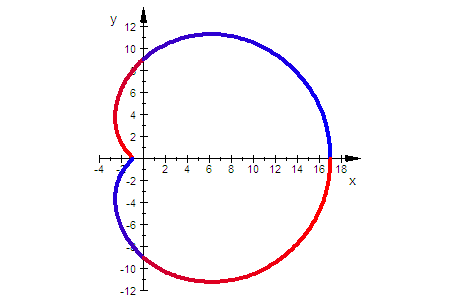
Kreis-Konchoiden, c=a Pascalsche Schnecken
=Kreissehnenkurven
Anregung zu ausfühlicherer Untersuchung von Zvonimir Durcevic, Wien
Prof. Dr. Dörte Haftendorn, Mathematik mit Mupad 3 im Juli 05
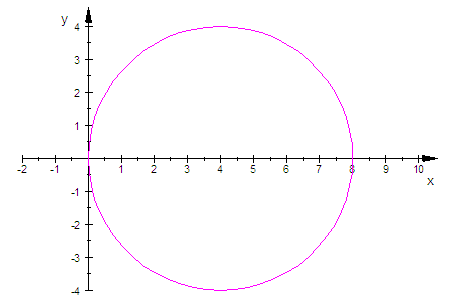
Polardarstellung von Kreisen um C=(a,0) mit Radius c
- rk:=t->a*cos(t)+sqrt(c^2-a^2*sin(t)^2)

Polardarstellung von Konchoiden zu diesen Kreisen


mit +f wäre auch möglich, von Herrn Durcevic nicht gemeint.
- kreis:=plot::Polar([rk(t),t],t=0..2*PI,LineColor=[1,0,1]
,ViewingBox=[-2..10,-c..c]):
plot(kreis)


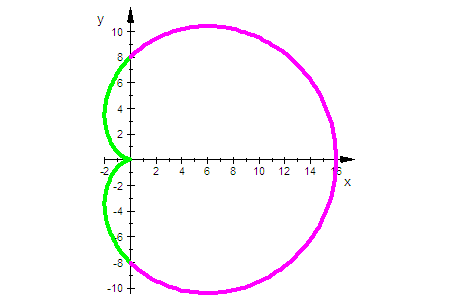
- f:=8:
konch:=plot::Polar([r(t),t],t=-PI/2..1*PI/2,
Color=[0,1,0],LineWidth=1):
konch2:=plot::Polar([rr(t),t],t=-PI/2..1*PI/2,
Color=[1,0,1],LineWidth=1):
plot(konch,konch2)

- allef:=(plot::Polar([r(t),t],t=3*PI/2..4*PI/2,LineWidth=1,
LineColorFunction=(t->[t/6,0,1-t/6]))$f=1..5):
allef2:=(plot::Polar([r(t),t],t=0..PI/2,LineWidth=1,
LineColorFunction=(t->[t/6,0,1-t/6]))$f=1..5):
allef3:=(plot::Polar([rr(t),t],t=0..PI/2,LineWidth=1,
LineColorFunction=(t->[t/6,0,1-t/6]))$f=1..5):
allef4:=(plot::Polar([rr(t),t],t=3*PI/2..4*PI/2,LineWidth=1,
LineColorFunction=(t->[t/6,0,1-t/6]))$f=1..5):
- plot(allef,allef2,allef3,allef4,kreis)
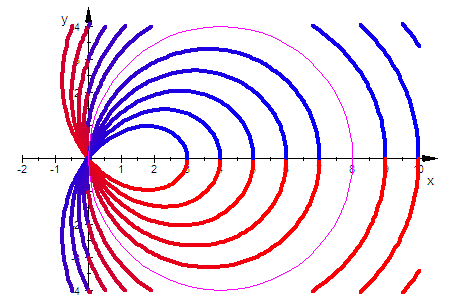

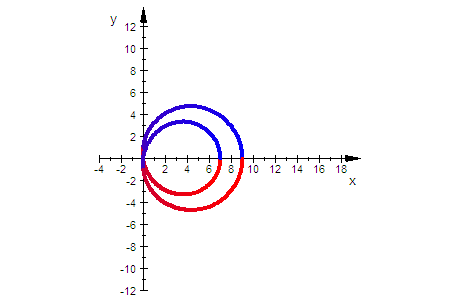
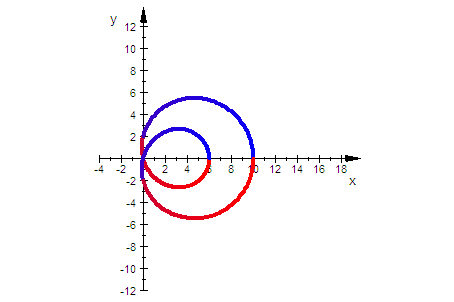
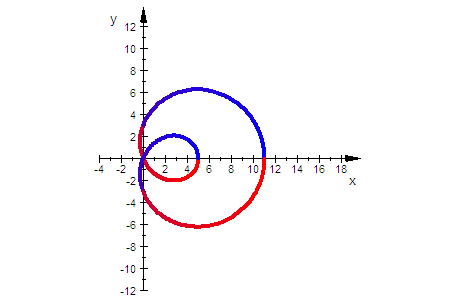
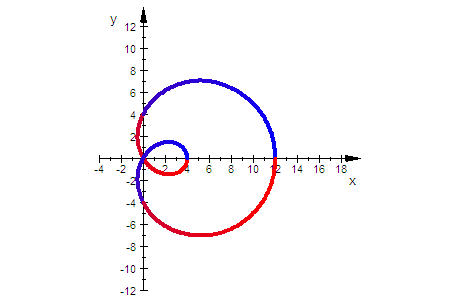
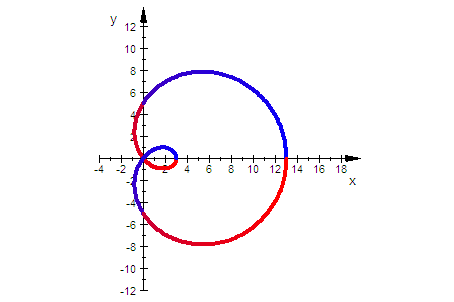
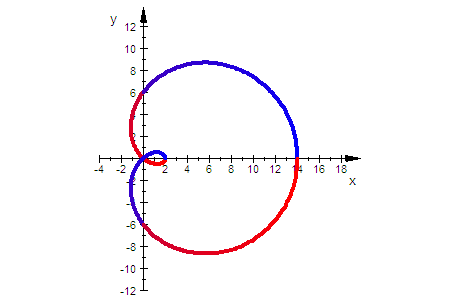
f=1 ist die äußere Kurve, es folgen 2,3,4
rechter Kurvenpunkt ist a+c-f
t=0 ist blau, t= Pi ist lila, t=2Pi ist rot
rechter Schlaufenpunkt ist bei a-c+f
- allef:=(plot::Polar([r(t),t],t=3*PI/2..4*PI/2,LineWidth=1,
LineColorFunction=(t->[t/6,0,1-t/6]))$f=6..9):
allef2:=(plot::Polar([r(t),t],t=0..PI/2,LineWidth=1,
LineColorFunction=(t->[t/6,0,1-t/6]))$f=6..9):
allef3:=(plot::Polar([rr(t),t],t=0..PI/2,LineWidth=1,
LineColorFunction=(t->[t/6,0,1-t/6]))$f=6..9):
allef4:=(plot::Polar([rr(t),t],t=3*PI/2..4*PI/2,LineWidth=1,
LineColorFunction=(t->[t/6,0,1-t/6]))$f=6..9):
plot(allef,allef2,allef3,allef4,kreis,
ViewingBox=[-4..18,-12..12])
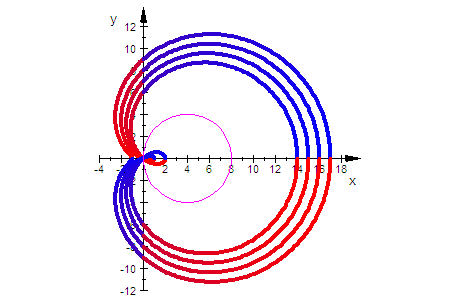

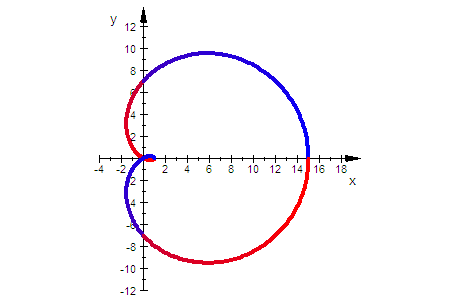
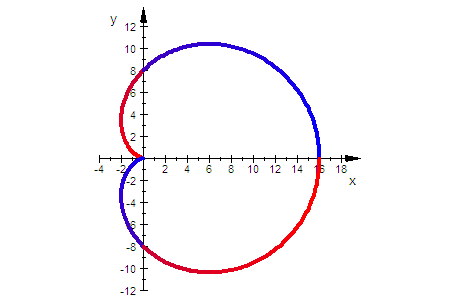
Diese besondere Lage entsteht bei c=f
####################################
Animation , in dieser Art merkwürdige Äste, besser unten
- plot(plot::Polar([r(t),t],t=0..2*PI,
LineColorFunction=(t->[t/6,0,1-t/6]),LineWidth=1,f=1..12),
plot::Polar([rr(t),t],t=0..2*PI,
LineColorFunction=(t->[t/6,0,1-t/6]),LineWidth=1,f=1..12),kreis)


- plot(
plot::Polar([r(t),t],t=3*PI/2..4*PI/2,LineWidth=1,
LineColorFunction=(t->[t/6,0,1-t/6]),f=1..9),
plot::Polar([r(t),t],t=0..PI/2,LineWidth=1,
LineColorFunction=(t->[t/6,0,1-t/6]),f=1..9),
plot::Polar([r(t),t],t=0..PI/2,LineWidth=1,
LineColorFunction=(t->[t/6,0,1-t/6]),f=1..9),
plot::Polar([rr(t),t],t=0..PI/2,LineWidth=1,
LineColorFunction=(t->[t/6,0,1-t/6]),f=1..9),
plot::Polar([rr(t),t],t=3*PI/2..4*PI/2,LineWidth=1,
LineColorFunction=(t->[t/6,0,1-t/6]),f=1..9),
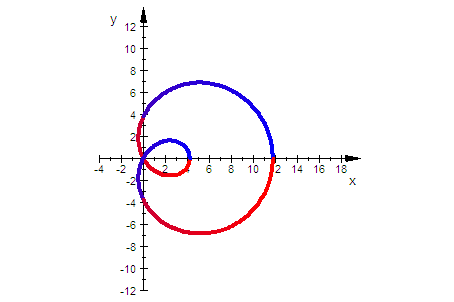
ViewingBox=[-4..18,-12..12])

- plot(
plot::Polar([r(t),t],t=3*PI/2..4*PI/2,LineWidth=1,
LineColorFunction=(t->[t/6,0,1-t/6])),
plot::Polar([r(t),t],t=0..PI/2,LineWidth=1,
LineColorFunction=(t->[t/6,0,1-t/6])),
plot::Polar([r(t),t],t=0..PI/2,LineWidth=1,
LineColorFunction=(t->[t/6,0,1-t/6])),
plot::Polar([rr(t),t],t=0..PI/2,LineWidth=1,
LineColorFunction=(t->[t/6,0,1-t/6])),
plot::Polar([rr(t),t],t=3*PI/2..4*PI/2,LineWidth=1,
LineColorFunction=(t->[t/6,0,1-t/6])),
ViewingBox=[-4..18,-12..12])$f=1..9
