plot(keg, eb,ko,ku,nv, Scaling=Constrained)
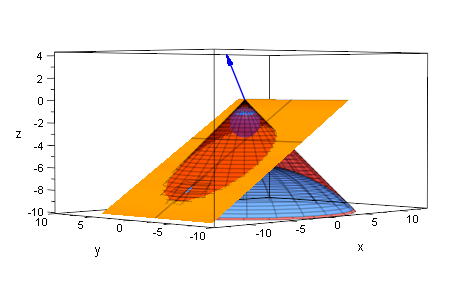
Dandelinsche Kugeln im Kegel
Prof. Dr. Dörte Haftendorn Nov. 06, http://haftendorn.uni-lueneburg.de
alpha:=PI/4:betta:=PI/3: m:=2:
d:=2*m*sin(alpha)/(sin(betta)-sin(alpha)):
R:=(m+d)*sin(alpha):
keg:=plot::Surface([h*tan(alpha)*cos(t),h*tan(alpha)*sin(t),-h],
t=0..2*PI,h=0..m+R/tan(betta)
,Color=[1,0,0,0.5],FillColorType=Flat, Mesh=[30,30]):
eb:=plot::Implicit3d(-cos(betta)*x+sin(betta)*z=-m*(sin(alpha)+sin(betta)),
x=-R..R,y=-R/2..R/2,z=-m-R/tan(betta)..0,
FillColorType=Flat,FillColor=[1,0.5,0,1]):
ko:=plot::Sphere(m*sin(alpha),[0,0,-m]):
ku:=plot::Surface([R*cos(t)*cos(phi),R*sin(t)*cos(phi),-(m+d)+R*sin(phi)],
t=0..2*PI,phi=PI/4..PI/2, FillColor=[0,0,1,0.8]):
nv:=plot::Arrow3d([-5*cos(betta),0,5*sin(betta)]):
line:=plot::Line3d([m*sin(alpha)*cos(t),m*sin(alpha)*sin(t),-m],
[(m+d)*sin(alpha)*cos(t),(m+d)*sin(alpha)*sin(t),-(m+d)],
LineWidth=0.8,LineColor=[0,1,0],t=0..2*PI):
plot(keg, eb,ko,ku,nv, Scaling=Constrained)
uf1:=m*sin(alpha)*cos(betta):
vf1 :=m*(1+sin(alpha)*sin(betta)) :
uf2:=(m+d)*sin(alpha)*cos(betta):
vf2 :=(m+d)*(1-sin(alpha)*sin(betta)) :
F1g:=plot::Point3d([uf1,0,-vf1], PointSize=40,
PointColor=RGB::Black):
F2g:=plot::Point3d([-uf2,0,-vf2], PointSize=40,
PointColor=RGB::Black):
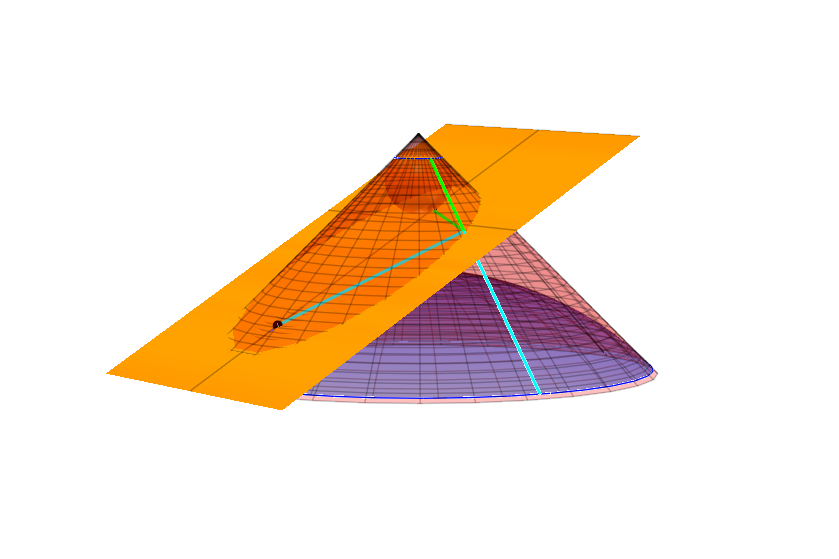
Wo schneidet die grüne Gerade die Ebene?
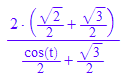
hz:=(cos(betta)*tan(alpha)*cos(t)+ sin(betta))^(-1)*m*(sin(alpha)+sin(betta))
lineM1:=plot::Line3d([m*cos(alpha)*sin(alpha)*cos(t),
m*cos(alpha)*sin(alpha)*sin(t),-m*cos(alpha)*cos(alpha)],
[hz*tan(alpha)*cos(t),hz*tan(alpha)*sin(t),-hz],
LineWidth=0.8,LineColor=[0,1,0],t=0..2*PI):
lineM2:=plot::Line3d([(m+d)*cos(alpha)*sin(alpha)*cos(t),
(m+d)*cos(alpha)*sin(alpha)*sin(t),-(m+d)*cos(alpha)*cos(alpha)],
[hz*tan(alpha)*cos(t),hz*tan(alpha)*sin(t),-hz],
LineWidth=0.8,LineColor=[0,1,1],t=0..2*PI):
lineF1:=plot::Line3d([uf1,0,-vf1],
[hz*tan(alpha)*cos(t),hz*tan(alpha)*sin(t),-hz],
LineWidth=0.8,LineColor=[0,1,0],t=0..2*PI):
lineF2:=plot::Line3d([-uf2,0,-vf2],
[hz*tan(alpha)*cos(t),hz*tan(alpha)*sin(t),-hz],
LineWidth=0.8,LineColor=[0,1,1],t=0..2*PI):
kro:=plot::Circle3d(m*cos(alpha)*sin(alpha),
[0,0,-m*cos(alpha)*cos(alpha)],[0,0,1]):
kru:=plot::Circle3d((m+d)*cos(alpha)*sin(alpha),
[0,0,-(m+d)*cos(alpha)*cos(alpha)],[0,0,1]):
kotr:=plot::Sphere(m*sin(alpha),[0,0,-m],FillColor=[1,0.5,0,0.85]):
kutr:=plot::Surface([R*cos(t)*cos(phi),R*sin(t)*cos(phi),-(m+d)+R*sin(phi)],
t=0..2*PI,phi=PI/4..PI/2,
FillColor=[0,0,1,0.8]):
kegleer:=plot::Surface([h*tan(alpha)*cos(t),h*tan(alpha)*sin(t),-h],
t=0..2*PI,h=0..m+R/tan(betta)
,Color=[1,0,0,0.25],FillColorType=Flat, Mesh=[30,30]):
plot(eb,lineM1,lineM2,lineF1,lineF2,F1g,F2g, kro,kru,kutr,
kotr,Axes=None,kegleer);
.