Kegelschnitte, Leitgeraden, Grundlegende Graphen
Prof. Dr. Dörte Haftendorn: Mathematik mit MuPAD 4, Jan. 07 Update 10.01.07
Web: www.mathematik-verstehen.de http://haftendorn.uni-lueneburg.de
#######################################################################
Diese Datei dient vor allem dem Herstellen von Klausur-Graphen
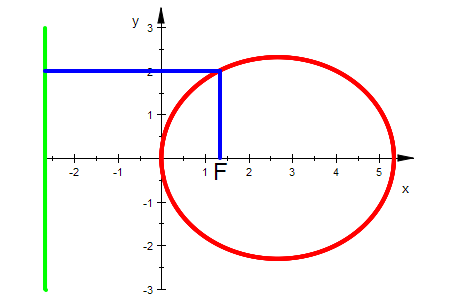
par:=plot::Implicit2d(y^2=2*p*x-(1-eps^2)*x^2,
x=-1..3,y=-3..3,
LineWidth=1,LineColor=[1,0,0]):
leit:=plot::Implicit2d(x=-p/2, x=-1..2,y=-3..3,
LineWidth=1,LineColor=[0,1,0]):
sperr1:=plot::Line2d([p/2,0],[p/2,p],
LineWidth=1,LineColor=[0,0,1]):
sperr2:=plot::Line2d([p/2,-p],[p/2,0],LineStyle=Dashed,
LineWidth=1,LineColor=[0,0,1]):
abst:=plot::Line2d([-p/2,p],[p/2,p],
LineWidth=1,LineColor=[0,0,1]):
Ftext:= plot::Text2d("F", [p/2, -0.86],
HorizontalAlignment = Center, TextFont=[18]):
plot(par, leit,sperr1,abst, Ftext,Scaling=Constrained);
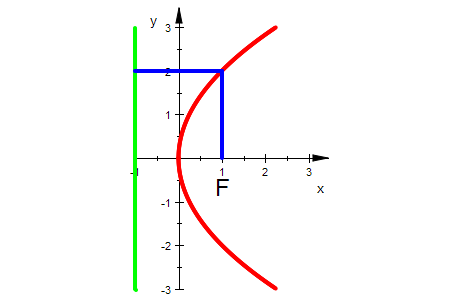
p:=2: eps:=1/2: ff:=p/(1+eps);m:=p/(1-eps^2); //m=a
b:=4/sqrt(3);


elli:=plot::Implicit2d(y^2=2*p*x-(1-eps^2)*x^2,
x=-1..m*2,y=-3..3,
LineWidth=1,LineColor=[1,0,0]):
leit:=plot::Implicit2d(x=-ff/eps, x=-ff/eps..ff*2,y=-3..3,
LineWidth=1,LineColor=[0,1,0]):
sperr1:=plot::Line2d([ff,0],[ff,p],
LineWidth=1,LineColor=[0,0,1]):
sperr2:=plot::Line2d([ff,-p],[ff,0],LineStyle=Dashed,
LineWidth=1,LineColor=[0,0,1]):
abst:=plot::Line2d([-ff/eps,p],[ff,p],
LineWidth=1,LineColor=[0,0,1]):
Ftext:= plot::Text2d("F", [ff, -0.5],
HorizontalAlignment = Center, TextFont=[18]):
plot(elli, leit,sperr1,abst,Ftext, Scaling=Constrained);
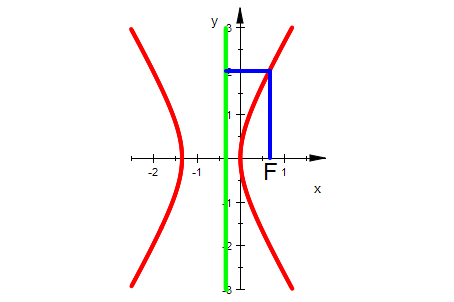
p:=2: eps:=2: ff:=p/(1+eps);m:=p/(1-eps^2);


hyp:=plot::Implicit2d(y^2=2*p*x-(1-eps^2)*x^2,
x=-2.5..1.5,y=-3..3,
LineWidth=1,LineColor=[1,0,0]):
leit:=plot::Implicit2d(x=-ff/eps, x=-ff/eps..ff*2,y=-3..3,
LineWidth=1,LineColor=[0,1,0]):
sperr1:=plot::Line2d([ff,0],[ff,p],
LineWidth=1,LineColor=[0,0,1]):
sperr2:=plot::Line2d([ff,-p],[ff,0],LineStyle=Dashed,
LineWidth=1,LineColor=[0,0,1]):
abst:=plot::Line2d([-ff/eps,p],[ff,p],
LineWidth=1,LineColor=[0,0,1]):
Ftext:= plot::Text2d("F", [ff, -0.5],
HorizontalAlignment = Center, TextFont=[18]):
plot(hyp, leit,sperr1,abst,Ftext, Scaling=Constrained);