datenPunkte:=[2,1], [3,2],[5,4],[6,3]:
dp:=datenPunkte;
![]()
Ausgleichsgeraden, Regressionskurven
Prof. Dr. Dörte Haftendorn, MuPAD 4, http://haftendorn.uni-lueneburg.de Aug.06
Automatische Übersetzung aus MuPAD 3.11, Nov. 05 Update 9.11.0
Es fehlen noch textliche Änderungen, die MuPAD 4 direkt berücksichtigen, das ist in Arbeit.
Web: http://haftendorn.uni-lueneburg.de www.mathematik-verstehen.de
+++++++++++++++++++++++++++++++++++++++++++++++++++++++++++++++++++++
datenPunkte:=[2,1], [3,2],[5,4],[6,3]:
dp:=datenPunkte;
![]()
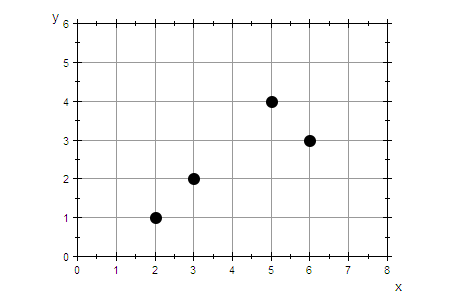
Gesucht ist eine "beste" Gerade durch die Datenpunkte
graphDatenPunkte:=plot::Listplot([datenPunkte],
LinesVisible=FALSE, PointSize=3,Scaling=Constrained,
GridVisible=TRUE,ViewingBox=[0..8,0..6]):
plot(graphDatenPunkte)
Umwandlung der Information über die Daten
in x-Liste und y-Liste
anz:=nops(dp)
![]()
xd:=[dp[i][1]$i=1..anz];
yd:=[dp[i][2]$i=1..anz];
![]()
![]()
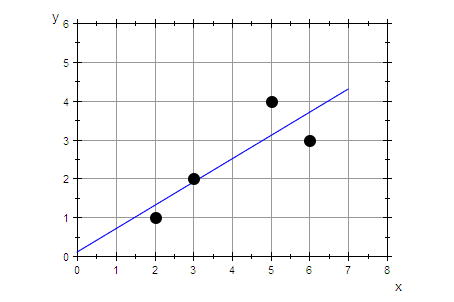
Für die lineare Regression gibt es einen eigenen Befehl.
Sie hat das Prinzip der kleinsten Fehlerquadratsumme als Grundlage.
reg:=stats::linReg(xd,yd)
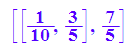
[[y-Abschnitt, Steigung], Fehlerquadratsumme]
b:=reg[1][1]: m:=reg[1][2]:
g:=x->m*x+b; g(x); float(%)
![]()
![]()
![]()
grreg:=plot::Function2d(g(x),x=0..7):
plot(grreg,graphDatenPunkte)
###################################
Beliebige Regressionskurven
Prinzip ist, dass hinter den Daten der gesuchte Funktionstyp mit Parametern
angegeben wird. Danach wird die Variablenliste und die Paramterliste genannt.
xd,yd
![]()
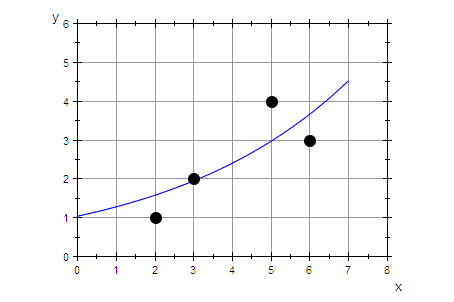
Exponentialfunktion 
regex:=stats::reg(xd,yd,c*exp(k*x), [x], [c, k])
![]()
c:=regex[1][1]: k:=regex[1][2]:
ex:=x->c*exp(k*x); ex(x); float(%)
![]()
![]()
![]()
grregex:=plot::Function2d(ex(x),x=0..7):
plot(grregex,graphDatenPunkte)
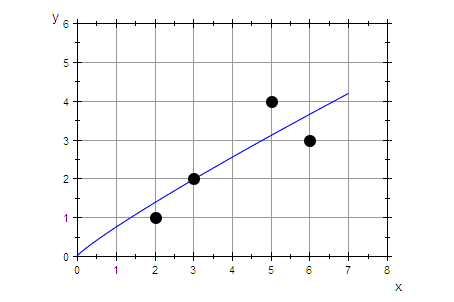
Potenzfunktion 
regpot:=stats::reg(xd,yd,c*x^k, [x], [c, k])
![]()
cp:=regpot[1][1]: kp:=regpot[1][2]:
pot:=x->cp*x^kp; pot(x); float(%);
![]()
![]()
![]()
grregpot:=plot::Function2d(pot(x),x=0..7):
plot(grregpot,graphDatenPunkte)
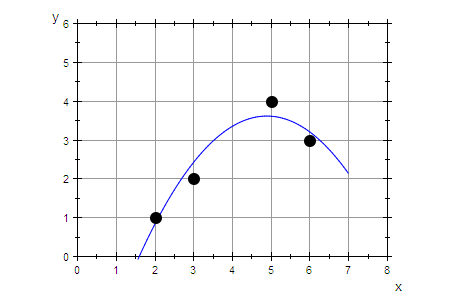
Parabel 
regpar:=stats::reg(xd,yd,A*x^2+B*x+C, [x], [A, B,C])
![]()
A:=regpar[1][1]: B:=regpar[1][2]: C:=regpar[1][3]:
par:=x->A*x^2+B*x+C; par(x)
![]()
![]()
grregpar:=plot::Function2d(par(x),x=0..7):
plot(grregpar,graphDatenPunkte)