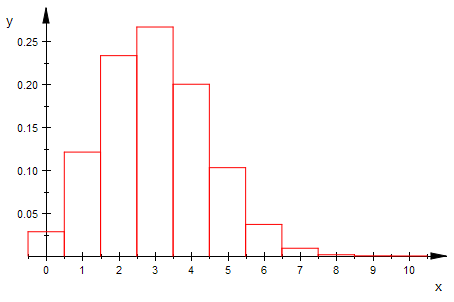
biHist(10,0.3,0,10,0)
![]()
Binomialverteilung, Histogramm
Prof. Dr. Dörte Haftendorn 9.5.08 MuPAD 4 Update vom 10. Mai 08
http:haftendorn.uni-lueneburg.de www.mathematik-verstehen.de
++++++++++++++++++++++++++++++++++++++++++++++++++++++++++++
Definition, die ein Histogamm passend zeichnet .
Für w=1 werden alle Werte ausgegeb, für w=0 nur my und sigma
biHist:=proc(n,p,kmin,kmax,w)
//w=1 alle Werte, w=0 nur my, sigma
local i,bipf,kmi,kma,li;
begin
bipf:=stats::binomialPF(n,p):
kmi:=round(kmin): kma:=round(kmax):
i:=kmi:li:=[]:
werte:=[i,bipf(i)] $ i=kmi..kma;
for i from kmi to kma do
li:=li.[[i-0.5,0],[i-0.5,bipf(i)],[i+0.5,bipf(i)],[i+0.5,0]];
end_for;
hist:=plot::Polygon2d(li,LineColor=[1,0,0]);
plot(hist);
if w=1 then
return(matrix(float([werte])));
else return(float(["my",n*p]),
float(["sigma",sqrt(n*p*(1-p))]))
end_if;
end_proc:
biHist(10,0.3,0,10,0)
![]()
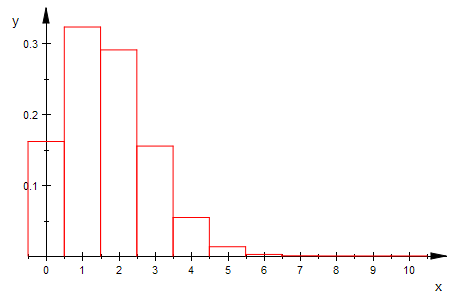
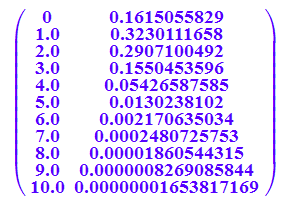
biHist(10,1/6,0,10,1)
nn:=300: pp:=0.3; my:=nn*pp;sig:=sqrt(nn*pp*(1-pp));
xmin:=my-4*sig;xmax:=my+4*sig;
![]()
![]()
![]()
![]()
![]()
biHist(nn,pp,xmin,xmax,0)
bicdf:=stats::binomialCDF(nn,pp):
plotfunc2d(0.5,bicdf(x),0.975,0.025,x=xmin..xmax,
LegendVisible=FALSE, GridVisible=TRUE)
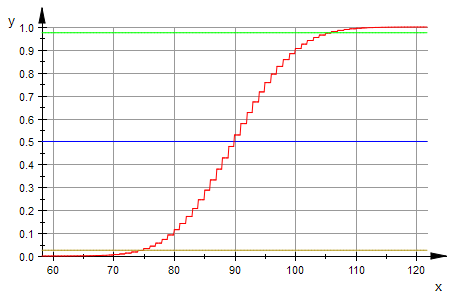
Erkunde dies mit dem Koordinatenwerkzeug