poissHist(1.25,10,1, GridVisible=TRUE)
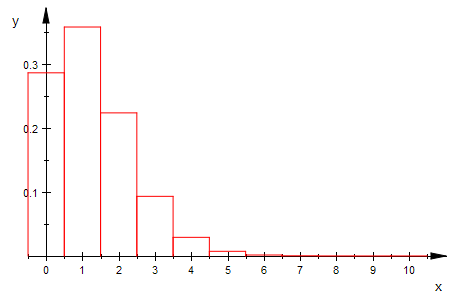
Poissonverteilung, Histogramm
Prof. Dr. Dörte Haftendorn 9.5.08 MuPAD 4 Update vom 10. Mai 08
http:haftendorn.uni-lueneburg.de www.mathematik-verstehen.de
++++++++++++++++++++++++++++++++++++++++++++++++++++++++++++
Definition, die ein Histogamm passend zeichnet .
Für w=1 werden alle Werte ausgegeb, für w=0 nur my und sigma
poissHist:=proc(my,kmax,w)
//w=1 alle Werte, w=0 nur my, sigma
local i,poisspf,kmi,kma,li;
begin
poisspf:=stats::poissonPF(my):
kmi:=0;kma:=round(kmax):
i:=kmi:li:=[]:
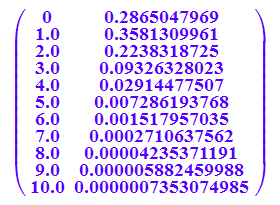
werte:=[i,poisspf(i)] $ i=kmi..kma;
for i from kmi to kma do
li:=li.[[i-0.5,0],[i-0.5,poisspf(i)],
[i+0.5,poisspf(i)],[i+0.5,0]];
end_for;
hist:=plot::Polygon2d(li,LineColor=[1,0,0]);
plot(hist);
if w=1 then
return(matrix(float([werte])));
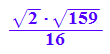
else return(float(["my",my]),
float(["sigma",sqrt(my)]))
end_if;
end_proc:
poissHist(1.25,10,1, GridVisible=TRUE)
Möglichkeit, my aus einem n und p zu errechnen.
Normalerweise wird aber my dirrekt eingegeben.
nn:=200: pp:=250/200^2; my:=nn*pp;sig:=sqrt(nn*pp*(1-pp));
/*xmin:=my-4*sig;*/xmax:=float(my+4*sig);
![]()
![]()
![]()
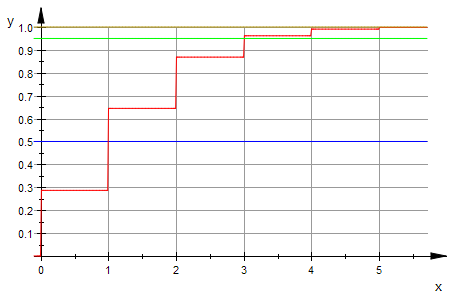
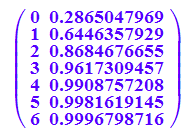
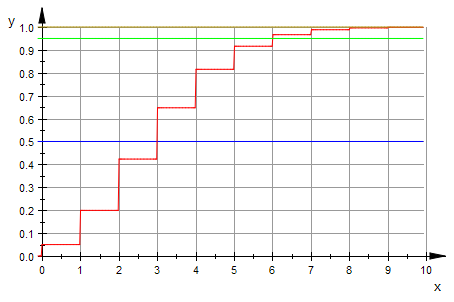
poisscdf:=stats::poissonCDF(1.25):
plotfunc2d(0.5,poisscdf(x),0.95,1,x=-0.1..xmax,
LegendVisible=FALSE, GridVisible=TRUE);
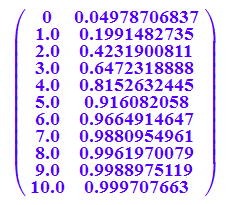
werte:=matrix([[i,poisscdf(i)] $ i=0..round(xmax)]);
Erkunde dies mit dem Koordinatenwerkzeug
############################################
Spielwiese
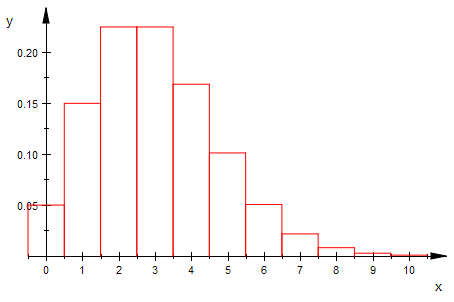
poissHist(3,10,1, GridVisible=TRUE)
Möglichkeit, my aus einem n und p zu errechnen.
Normalerweise wird aber my dirrekt eingegeben.
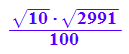
nn:=1000: pp:=3000/1000^2; my:=nn*pp;sig:=sqrt(nn*pp*(1-pp));
/*xmin:=my-4*sig;*/xmax:=float(my+4*sig);
![]()
![]()
![]()
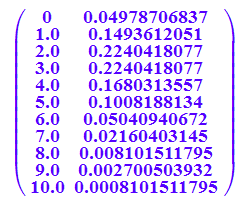
poisscdf:=stats::poissonCDF(my):
plotfunc2d(0.5,poisscdf(x),0.95,1,x=-0.1..xmax,
LegendVisible=FALSE, GridVisible=TRUE);
werte:=matrix([float([i,float(poisscdf(i))]) $ i=0..round(xmax)]);
Erkunde dies mit dem Koordinatenwerkzeug
############################################