Download des MuPAD-Notebooks (240 KB) Save Link Taget As..., Verküpfung speichern unter...
 Graphen in MuPAD
Mathematik mit MuPAD 2, Prof. Dr. Dörte Haftendorn 4.12.01 Version vom 16.10.02
LLLLLLLLLL-------Level 1-------LLLLLLLLLL
Einfaches Zeichnen von Funktionsgraphen: Klicke das Graphik2d-Icon und trage den Funktionsterm ein.
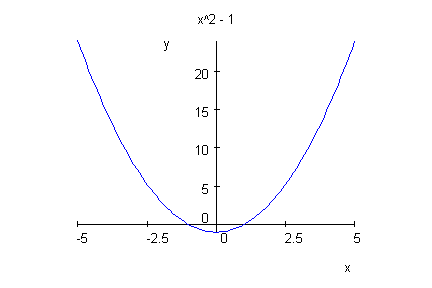

Für einen anderen Bereich wird noch eingefügt:


Weitere Optionen werden danach genannt, weitere Terme stehen einfach vorne:
- plotfunc2d(x^2,2-x^3,x=-1..2, Scaling=Constrained,LineWidth=20,
GridLines=Automatic, ViewingBox=[-1..2,-1..3] )
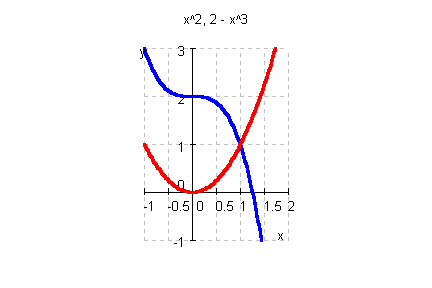

Ineraktiv kann man auch Farben verändern, das bleibt bei neuer Auswertung allerdings nicht erhalten.
(Andere Möglichkeiten bei Level 2)
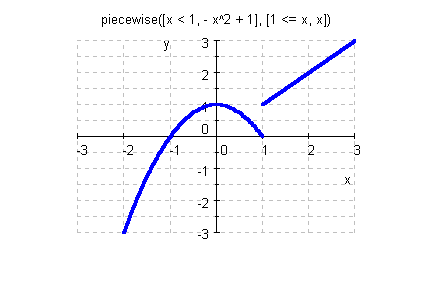
Besondere Funktionen, z.B. stückweise definierte:
- f := piecewise([x < 1, -x^2 + 1], [x >= 1, x]):
plotfunc2d(GridLines=Automatic,
Ticks = [Steps = 1, Steps = [1,1]],LineWidth=20,
f(x), x = -3..3, y = -3..3):
LLLLLLLLLL-------Level 2-------LLLLLLLLLL
Um Graphen verschiedenen Typs kombinieren zu können, gibt es nun in MuPAD die Möglichkeit
sogenannte "Graphik-Primitive" zu erzeugen. Das sind Graphik-Bausteine, die selbst nicht sichtbar sind,
sondern erst durch die Funktion plot dargestellt werden.
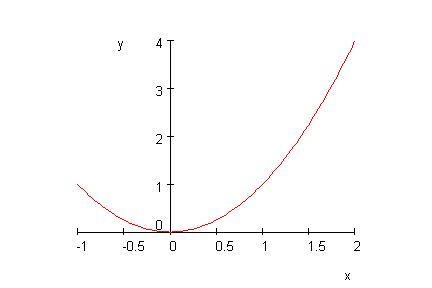
Einfachste Version ist:
- fkt:=plot::Function2d(x^2,x=-1..2):
plot(fkt)

Das lohnt sich so noch nicht, aber wenn man nun darein etwas zeichnen will, geht das so:
- drei:=plot::Polygon([-1,1],[0.5,0.25],[2,4],[-1,1],
Filled=TRUE, Color=[0.8,0.8,0.9]):
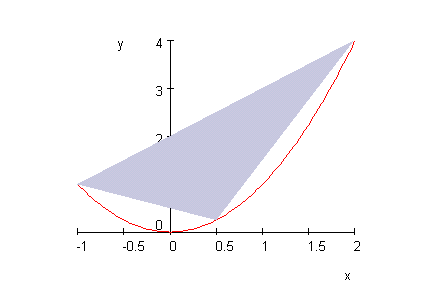

Während man bei plotfunc2d(%?) nur interaktiv Farben ändern kann, hat man hier mehr Möglichkeiten:
- fkt:=plot::Function2d(x^2,x=-1..2,LineWidth=20, Color=RGB::Green):
plot(fkt,drei)
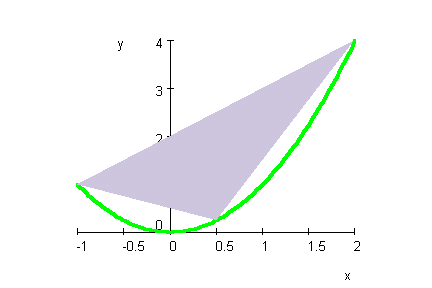

Optionen für die Gesamtansicht, die Szene, kann man folgendermaßen beeinflussen:
- sc:=plot::Scene(fkt, drei,GridLines=Automatic):
plot(sc)
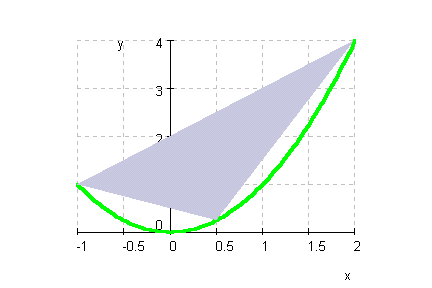

Grundsätzlich kann man Eigenschaften der Szene ändern. Vorgewählt ist:
- plot::Scene::defaultOptions2d
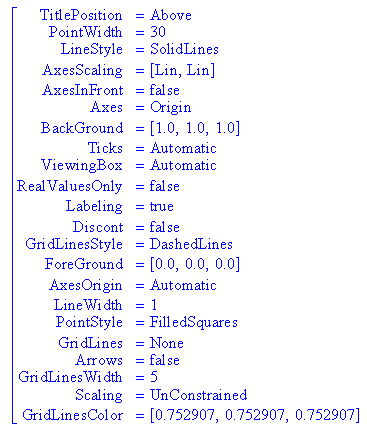
Auch die Eigenschaften der Graphikprimitiven kann man ändern:
- fktneu:=plot::modify(fkt,Color=[Height]):
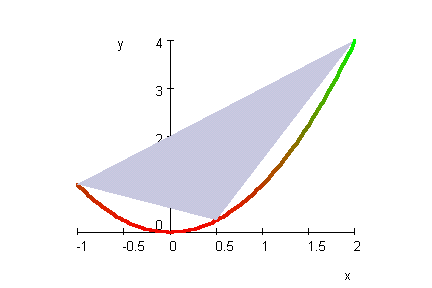


Die Graphikprimitiven sind Objekte, an deren Eigenschaften man auch ähnlich wie in
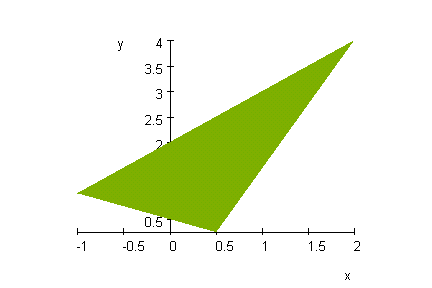
Programmiersprachen herankommt:

- drei::Color:=[Flat,[0.5,0.7,0]]:plot(drei) //neu definieren

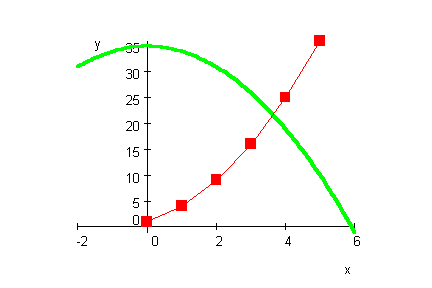
Punktegraphen
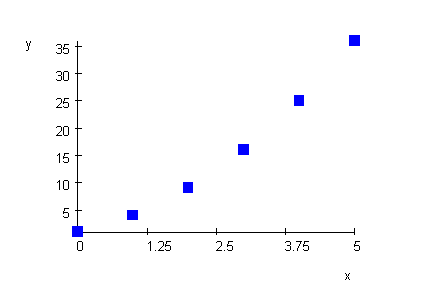
- xD:= [i $ i=0..5] //Liste von Abszissen

- yD:= [(i+1)^2 $ i=0..5 ] //Liste von Ordinaten

- PunktGraph:=plot::Pointlist(op(zip(xD,yD,plot::Point)),
Color=RGB::Blue,PointWidth=80):plot(PunktGraph)

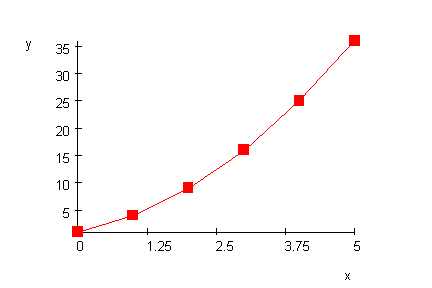
- LinienGraph:=plot::Pointlist(op(zip(xD,yD,plot::Point)),
DrawMode=Connected,PointWidth=80):plot(LinienGraph)

- parabel:=plot::Function2d(35-x^2,x=-2..6,LineWidth=20,
Color=RGB::Green): plot(parabel,LinienGraph)

Schwierigere graphische Möglichkeiten sind in
eigenen Notebooks untergebracht:
IterationLogParabel.mnb für Iteration und Web-Dartstellung
IntegralGraphen.mnb für Balkendarstellungen und Näherungen
implicitMupad.mnb aus der Hilfe für implizite Kurven
algebraischeKurven.mnb für meine diversen Kurven
----------------------------------------
Parameterdarstellung, Polarkoordinaten usw. gibt es natürlich auch
Library 'plot': graphical primitives and functions for two- and three-dimensio\
nal plots

-- Interface:
plot::Curve2d,    plot::Curve3d,    plot::Ellipse2d,   plot::Function2d,
plot::Function3d, plot::Group,      plot::HOrbital,    plot::Lsys,
plot::Point,      plot::Pointlist,  plot::Polygon,     plot::Rectangle2d,
plot::Scene,      plot::Surface3d,  plot::Turtle,      plot::bars,
plot::boxplot,    plot::contour,    plot::copy,        plot::cylindrical,
plot::data,       plot::density,    plot::implicit,    plot::inequality,
plot::line,       plot::matrixplot, plot::modify,      plot::ode,
plot::piechart2d, plot::piechart3d, plot::polar,       plot::spherical,
plot::surface,    plot::vector,     plot::vectorfield, plot::xrotate,
plot::yrotate

-- Exported:
plot, plot2d, plot3d, plotfunc2d, plotfunc3d

Weitere Informationen erhält man dann durch den Befehl ?Name
Dann geht ein Fenster auf, in dem man die ausführliche Anzeige wählen kann.
Mit Hilfe der in das Notebook ziehbaren Beispiele hangelt man sich weiter.
Graphen3D ->graphen3D.mnb


