[Gleichungsübersicht, alle Darstellungsarten [Implizite Gleichungen für die Bildergalerie] [Bildergalerie]
Algebraische Kurven Gleichungsübersicht Teil1
Mathematik mit MuPAD 2, Prof. Dr. Dörte Haftendorn 3.12.01 Version vom 7.12.01
Wegen der Größe des MuPAD-Notebooks gibt es 3 Teile.
ellipse::LineWidth:=15:
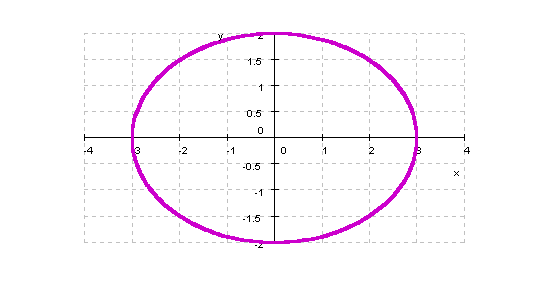
![]()
Man könnte noch
Scaling=Constrained in die Optionen einfügen, aber dann werdendie Bilder sehr viel kleiner mit viel weißem Rand darum. Das ist ungünstig. So zieht man einfach nach Sicht.
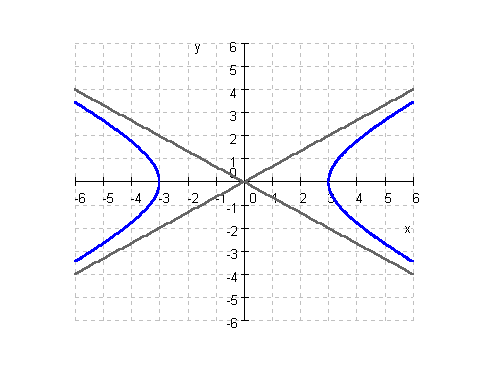
hyperbel::Color:=RGB::Blue:hyperbel::LineWidth:=15:
asymptoten::LineWidth:=15:
asymptote1:=plot::Function2d(b/a*x,x = -6..6,
Color=grau,LineWidth=12):
asymptote2:=plot::Function2d(-b/a*x,x = -6..6,
Color=grau,LineWidth=12):
ViewingBox=[-6..6,-6..6],GridLines=Automatic,Ticks=12
)//Scaling=Constrained
![]()
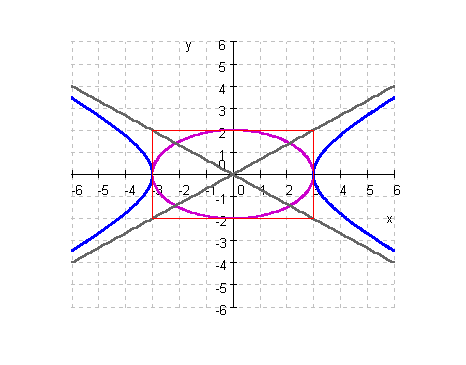
Harmonie der Kegelschnitte,
ausführlich auf einer Extraseite der WebsiteViewingBox=[-6..6,-6..6],GridLines=Automatic,Ticks=12
)//Scaling=Constrained
![]()
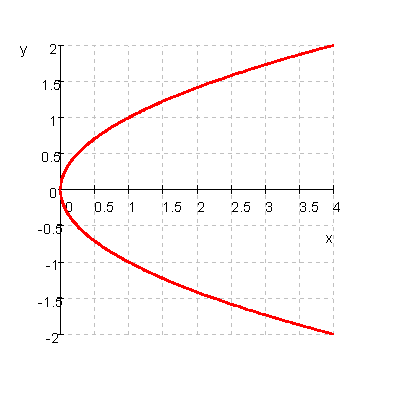
GridLines=Automatic,ViewingBox=[0..4,-2..2],Ticks=8)
![]()
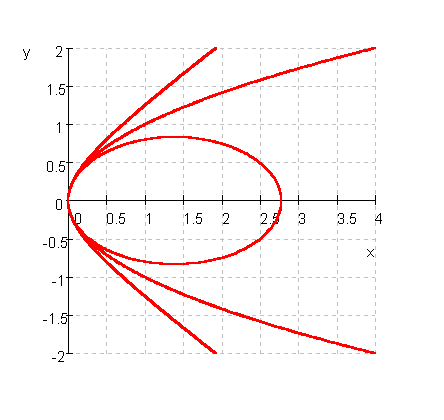
Allgemeine Scheitelgleichung der Kegelschnitte
eps:=1.25:konicH:=plot::implicit(y^2-2*p*x+(1-eps^2)*x^2,x = 0..4, y = -2..2):
eps:=1:konicP:=plot::implicit(y^2-2*p*x+(1-eps^2)*x^2,x = 0..4, y = -2..2):
eps:=0.8:konicE:=plot::implicit(y^2-2*p*x+(1-eps^2)*x^2,x = 0..4, y = -2..2):
plot(konicH,konicP,konicE,LineWidth=15,
GridLines=Automatic,ViewingBox=[0..4,-2..2],Ticks=8)
![]()
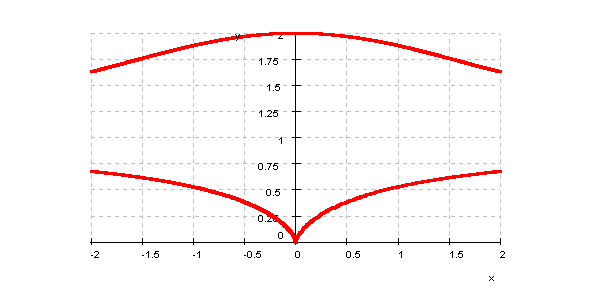
plot(konchoide,LineWidth=15,
GridLines=Automatic,ViewingBox=[-2..2,-0..2],Ticks=8)
![]()
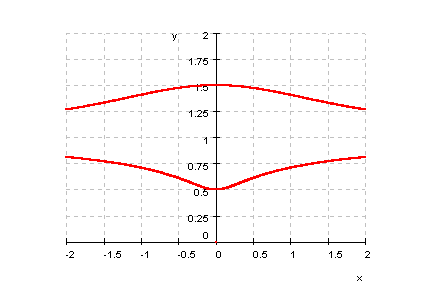
plot(konchoide,LineWidth=15,
GridLines=Automatic,ViewingBox=[-2..2,-0..2],Ticks=8)
![]()
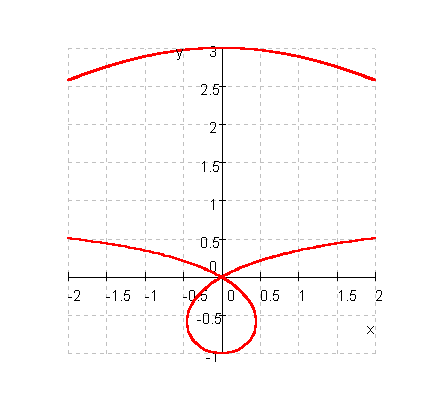
plot(konchoide,LineWidth=15,
GridLines=Automatic,ViewingBox=[-2..2,-1..3],Ticks=8)
![]()
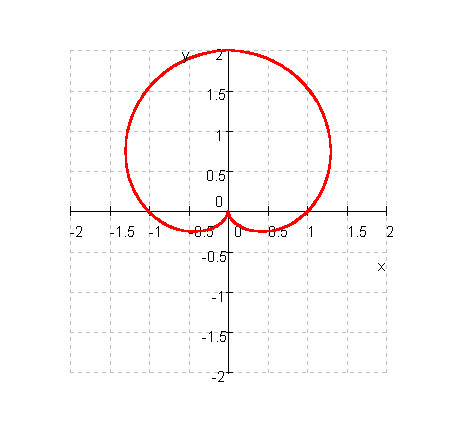
x = -2..2, y = -2..2)://Kardioide
plot(pascalschnecke,LineWidth=15,
GridLines=Automatic,ViewingBox=[-2..2,-2..2],Ticks=8)
![]()
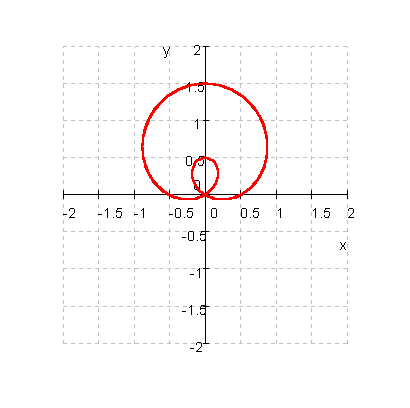
x = -2..2, y = -2..2):
plot(pascalschnecke,LineWidth=15,
GridLines=Automatic,ViewingBox=[-2..2,-2..2],Ticks=8)
![]()
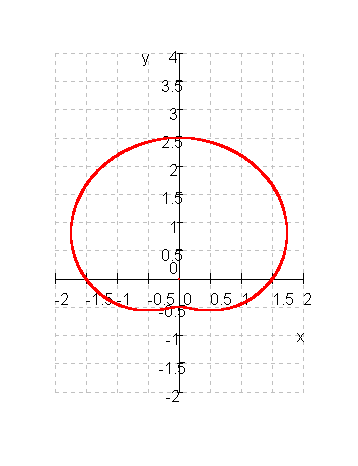
x = -2..2, y = -2..4):
plot(pascalschnecke,LineWidth=15,
GridLines=Automatic,ViewingBox=[-2..2,-2..4],Ticks=8)
![]()