[Gleichungsübersicht, alle Darstellungsarten [Implizite Gleichungen für die Bildergalerie] [Bildergalerie]
Algebraische Kurven Gleichungsübersicht Teil 2
Mathematik mit MuPAD 2, Prof. Dr. Dörte Haftendorn 3.12.01 Version vom 7.12.01
Die Gleichungsübersicht ist auch in Html auf der Website und in Word verfügbar.
Wegen der Größe des MuPAD-Notebooks gibt es 3 Teile.
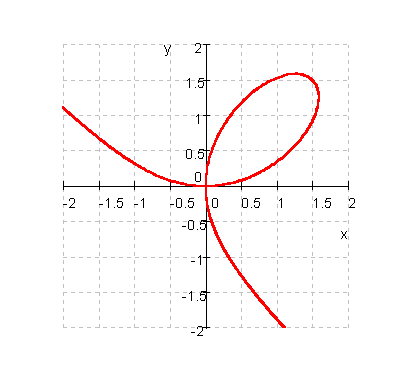
x = -2..2, y = -2..2):
plot(karthesischesblatt,LineWidth=15,
GridLines=Automatic,ViewingBox=[-2..2,-2..2],Ticks=8)
![]()
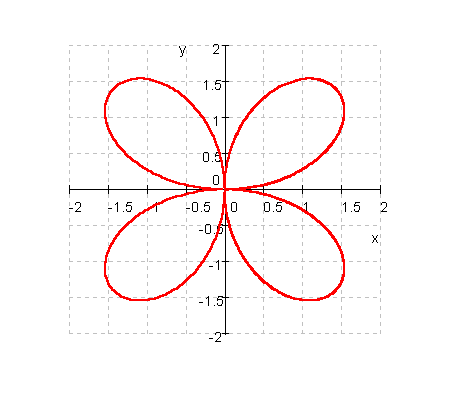
x = -2..2, y = -2..2):
plot(rosette,LineWidth=15,
GridLines=Automatic,ViewingBox=[-2..2,-2..2],Ticks=8)
![]()
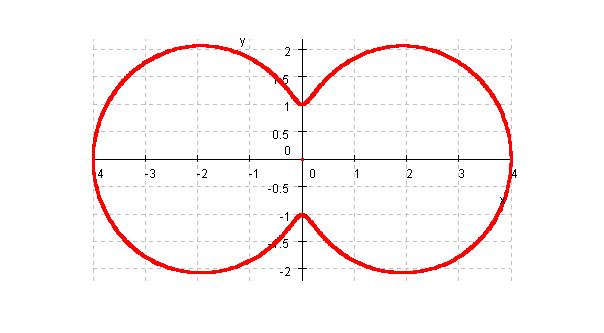
x = -4..4, y = -2.2..2.2):
plot(boothlemniskate,LineWidth=15,
GridLines=Automatic,ViewingBox=[-4..4,-2.2..2.2],Ticks=8)
![]()
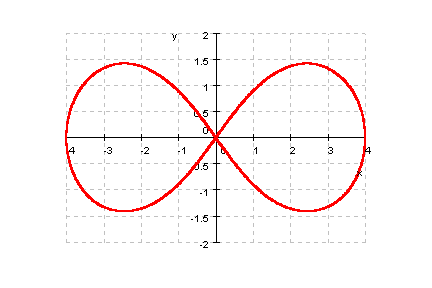
x = -4..4, y = -2..2):
plot(bernoullilemniskate,LineWidth=15,
GridLines=Automatic,ViewingBox=[-4..4,-2..2],Ticks=8)
![]()
x = -4..4, y = -0..2.2):
plot(kissoide,LineWidth=15,
GridLines=Automatic,ViewingBox=[-4..4,-0..2.2],Ticks=8)

![]()
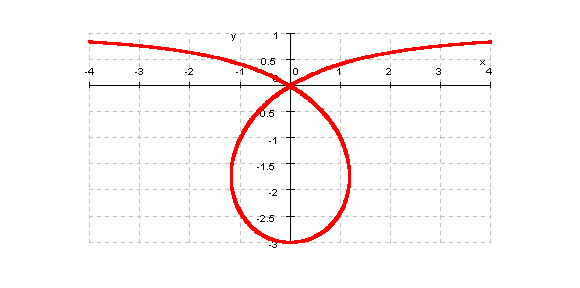
x = -4..4, y = -3..1):
plot(allgkissoide,LineWidth=15,
GridLines=Automatic,ViewingBox=[-4..4,-3..1],Ticks=8)
![]()
x = -4..4, y = -1..1):
plot(strophoide,LineWidth=15,
GridLines=Automatic,ViewingBox=[-4..4,-1..1],Ticks=8)

![]()
Die Strophoide ist eine spezielle Kissoide, nämlich die für eps^2=2
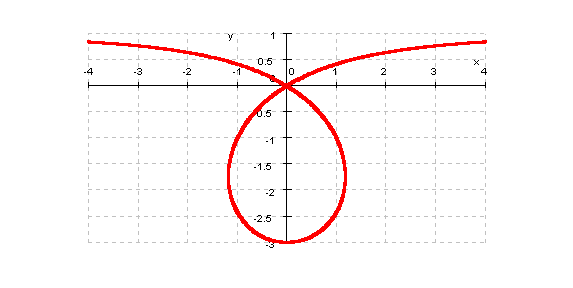
x = -4..4, y = -3..1):
plot(trisektrix,LineWidth=15,
GridLines=Automatic,ViewingBox=[-4..4,-3..1],Ticks=8)
![]()
Die Trisektrix ist eine spezielle Kissoide, nämlich die für eps=2
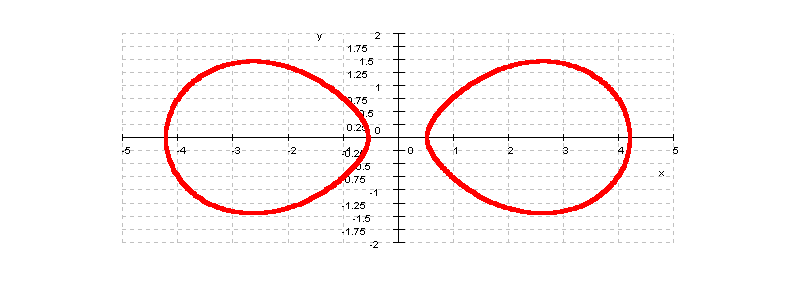
x = -5..5, y = -2..2):
plot(cassini,LineWidth=15,
GridLines=Automatic,ViewingBox=[-5..5,-2..2],Ticks=10)
![]()
x = -4..4, y = -2..2):
plot(cassini,LineWidth=15,
GridLines=Automatic,ViewingBox=[-4..4,-2..2],Ticks=10)

![]()
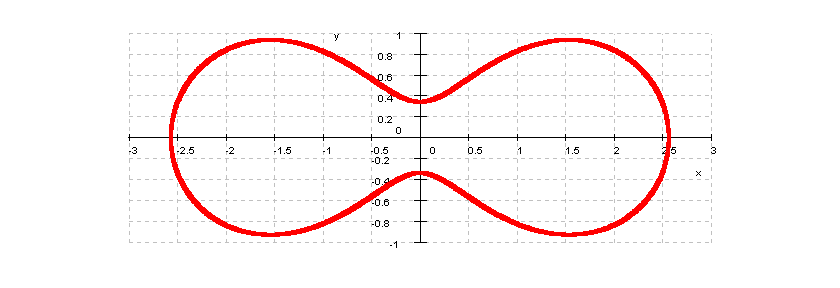
x = -3..3, y = -1..1):
plot(cassini,LineWidth=15,
GridLines=Automatic,ViewingBox=[-3..3,-1..1],Ticks=10)
![]()
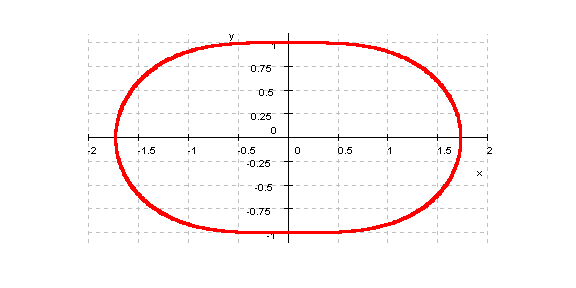
x = -2..2, y = -1..1):
plot(cassini,LineWidth=15,
GridLines=Automatic,ViewingBox=[-2..2,-1.1..1.1],Ticks=8)
![]()
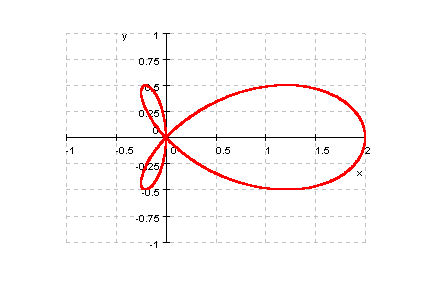
x = -1..2, y = -1..1):
plot(dreiblatt,LineWidth=15,
GridLines=Automatic,ViewingBox=[-1..2,-1..1],Ticks=6)
![]()